
-
11 Oct
North Vancouver Detached Home Chart
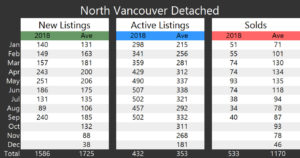
These are the year to date stats for North Vancouver against the average over the last 20 years. The columns are the amount of new listings each month, the active amount of listings at the end of the month and the amount of solds each month.


-

Angell Hasman and Assoc.
(The Angell Group) Rlty.